This post gives you a simple summary of the most needed WinDbg commands for .NET. The most of the examples are heavily inspired by Konrad Kokosa’s excellent book Pro .NET Memory Management.
For troubleshooting .NET (Core) memory or performance issues, there’re a lot of free or commercial tools available. One of the most advanced and complicated is undoubtedly WinDbg, every .NET developer should known.
WinDbg is free and included with the Windows 10 SDK. But there’s also a Preview version available from the Microsoft Store which comes with other nice features and dark theme support.
The official MSDN description says:
The Windows Debugger (WinDbg) can be used to debug kernel-mode and user-mode code, to analyze crash dumps, and to examine the CPU registers while the code executes.
WinDbg is basically a debugger for native applications. To debug CLR and managed code, you must load the SOS debugging extension into WinDbg. There some other useful extensions with additional features available for free:
In this post, I am focusing on the SOS debugging extension which is installed by default with the .NET Framework or .NET Core.
Installation path for .NET Framework:
| Platform | Path |
|---|---|
| 32bit | C:\Windows\Microsoft.NET\Framework\v4.0.30319\SOS.dll |
| 64bit | C:\Windows\Microsoft.NET\Framework64\v4.0.30319\SOS.dll |
Installation path for .NET Core:
| Platform | Path |
|---|---|
| 32bit | C:\Program Files (x86)\dotnet\shared\Microsoft.NETCore.App\2.2.0\sos.dll |
| 64bit | C:\Program Files\dotnet\shared\Microsoft.NETCore.App\2.2.1\sos.dll |
Although WinDb supports attaching a running process, for productive scenarios you’ll usually create a memory dump of a erroneous process first. So you can analyze the dump on a developer machine later, without breaking your productive application. Under Windows, several options are available for creating a memory dump. The Windows Task Manager, Sysinternals Process Explorer or Sysinternals ProcDump, my favourite tool.
To create a memory dump with procdump simply execute the following command, where <PID> is the Id of the process to dump.
-ma : Write a dump file with all process memory. The default dump format only includes thread and handle information.
$ procdump -ma <PID>
Before you create a memory dump, always check for the bitness of the process to dump, so you can ensure you’re using the right tool. For example, procdump comes as procdump.exe and procdump64.exe. For more information see Choosing the 32-Bit or 64-Bit Debugging Tools.
Sample Application
I have used the following .NET Core program in this post as an example application. A memory dump was created at runtime and loaded into WinDbg.
namespace MemoryLeaker
{
    class Program
    {
        class MyData
        {
            public long[] Data { get; set; }
        }

        private static List<MyData> _data = new List<MyData>();
        public static void Main()
        {
            Console.WriteLine(Process.GetCurrentProcess().Id);

            int count = 0;
            while (count < 100_000)
            {
                _data.Add(new MyData { Data = new long[1024] });
                Thread.Sleep(5);
            }
        }
    }
}
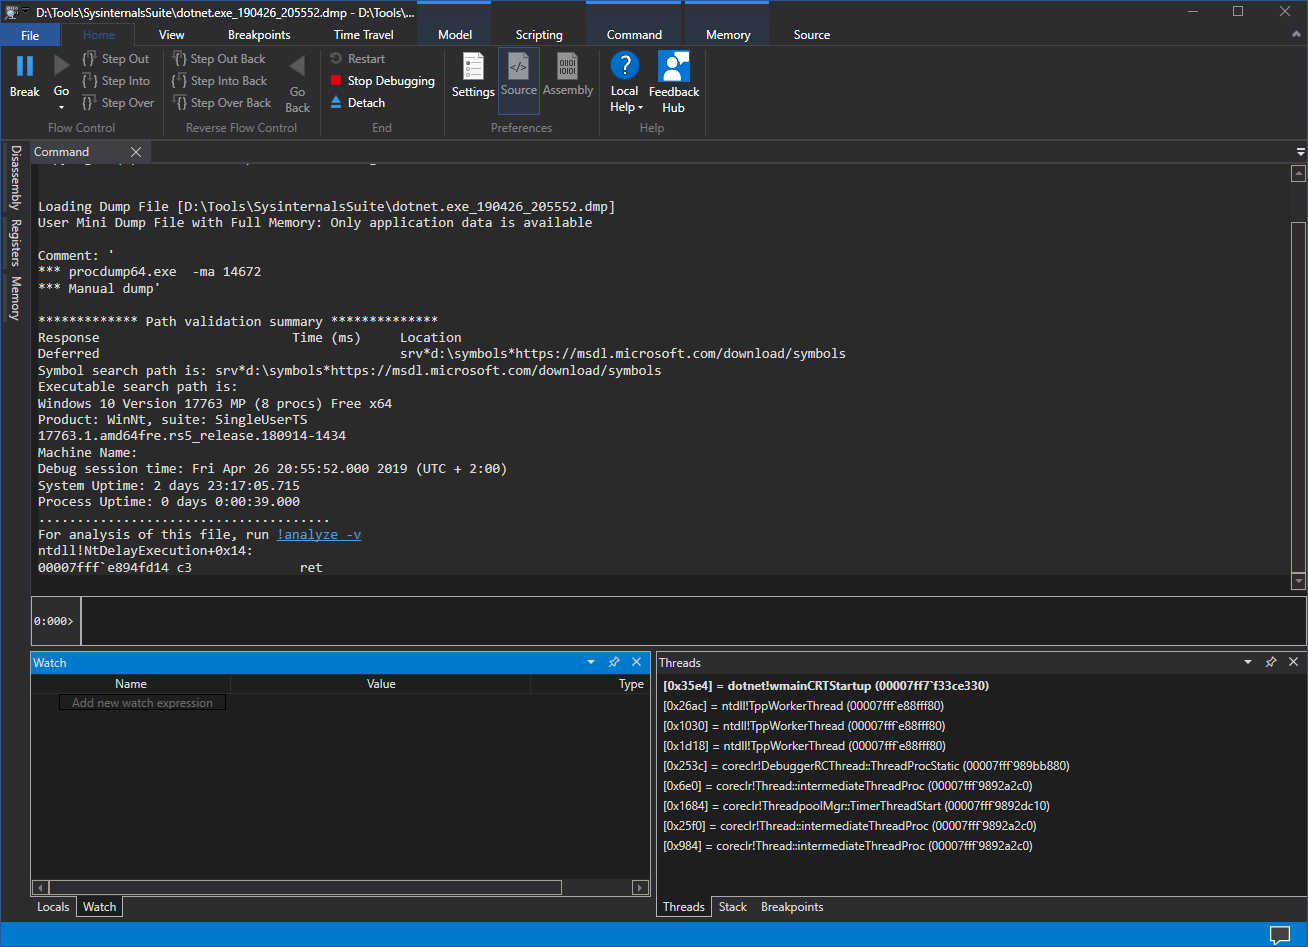
Now, fire up WinDbg (the screenshot below shows the Preview-Version), choose File->Open dump file and select the the dump file you’ve just created
SOS Extension
First, load the SOS extension into the debugger using the .load command. In my example, I’m analyzing a .NET Core memory dump, so I’m loading the appropriate SOS extension.
.load C:\Program Files\dotnet\shared\Microsoft.NETCore.App\2.2.1\sos.dll
Whether the extension was loaded successfully can be checked by executing the sos.help command.
!sos.help
This should provide a list of all available commands.
GC Heap
DumpHeap displays information about the garbage-collected heap and collection statistics about objects.
The -stat option restricts the output to the statistical type and gives you a nice summary about the GC heap.
!DumpHeap -stat

...excerpt
00007fff8c4b6c08        2          944 System.Globalization.CultureData
00007fff8c497ad8       19         1104 System.String[]
00007fff8c4b8da8       36         1440 System.RuntimeType
00007fff8c499cb8        8         3884 System.Byte[]
00007fff8c4971b8        7        17736 System.Object[]
00007fff8c4b4728      164        36502 System.String
00007fff38f84a30        2        65584 MemoryLeaker.MyData[]
00007fff38dd6668     6764       162336 MemoryLeaker.MyData
000002450730aa40       69       169408      Free
00007fff8c493960     6764     55573024 System.Int64[]
Total 14028 objects
If you are looking for a specific type use the -type option which lists only those objects whose type name is a substring match of the specified string. It is possible to combine with -stat option
!DumpHeap -stat -type MemoryLeaker.MyData

...excerpt
Statistics:
              MT    Count    TotalSize Class Name
00007fff38ddabb0        1           40 System.Collections.Generic.List`1[[MemoryLeaker.MyData, MemoryLeaker]]
00007fff38f84a30        2        65584 MemoryLeaker.MyData[]
00007fff38dd6668     6764       162336 MemoryLeaker.MyData
Total 6767 objects
The -mt option lists only those objects that correspond to the specified MethodTable structure.
!DumpHeap -mt 00007fff38dd6668

...excerpt
000002450c7e9938 00007fff38dd6668       24
000002450c7eb968 00007fff38dd6668       24
000002450c7ed998 00007fff38dd6668       24

Statistics:
              MT    Count    TotalSize Class Name
00007fff38dd6668     6764       162336 MemoryLeaker.MyData
Total 6764 objects
Object Inspection
DumpObj displays information about an object at the specified address.
!DumpObj 000002450c7ed998

Name:        MemoryLeaker.MyData
MethodTable: 00007fff38dd6668
EEClass:     00007fff38f711e8
Size:        24(0x18) bytes
File:        d:\dev\MemoryLeaker\MemoryLeaker\bin\Debug\netcoreapp2.2\MemoryLeaker.dll
Fields:
              MT    Field   Offset                 Type VT     Attr            Value Name
00007fff8c493960  4000001        8       System.Int64[]  0 instance 000002450c7ed9b0 <Data>k__BackingField
ObjSize displays the size of the specified object by its address. The ObjSize command includes the size of all child objects in addition to the parent.
!ObjSize 000002450c7ed998

sizeof(000002450c7ed998) = 8240 (0x2030) bytes (MemoryLeaker.MyData)
DumpArray can be used to display information about an array. A detailed display of the elements can be achieved with the -details option. The -start option specifies the starting index at which to display elements. The -length option specifies how many elements to show.
!DumpArray -start 0 -length 1 -details 000002450b2ea528

...excerpt
Name:        MemoryLeaker.MyData[]
MethodTable: 00007fff38f84a30
EEClass:     00007fff8bb56c08
Size:        65560(0x10018) bytes
Array:       Rank 1, Number of elements 8192, Type CLASS
Element Methodtable: 00007fff38dd6668
[0] 00000245092a60a8
    Name:        MemoryLeaker.MyData
    MethodTable: 00007fff38dd6668
    EEClass:     00007fff38f711e8
    Size:        24(0x18) bytes
    File:        d:\dev\MemoryLeaker\MemoryLeaker\bin\Debug\netcoreapp2.2\MemoryLeaker.dll
    Fields:
                      MT    Field   Offset                 Type VT     Attr            Value Name
        00007fff8c493960  4000001        8           System.Int64[]      0     instance     00000245092a6100     <Data>k__BackingField
Recently Andy Luhrs talked at Microsoft’s Build 2019 about Getting familiar with WinDbg Preview. More information about WinDbg can be found on MSDN, on the team’s official blog, or on Channel 9.